I recently had an “Ask the Doctor” question that went something like this: “I need to report impurities for my product at levels of 0.1-0.5% of the main ingredient. Occasionally when I show my folks my chromatograms, I’m accused of making the sample too concentrated, because the product peak is >2000 mAU. They tell me that the detector is saturated, so the area-% for the impurities will not be accurate. Can you comment on this?”
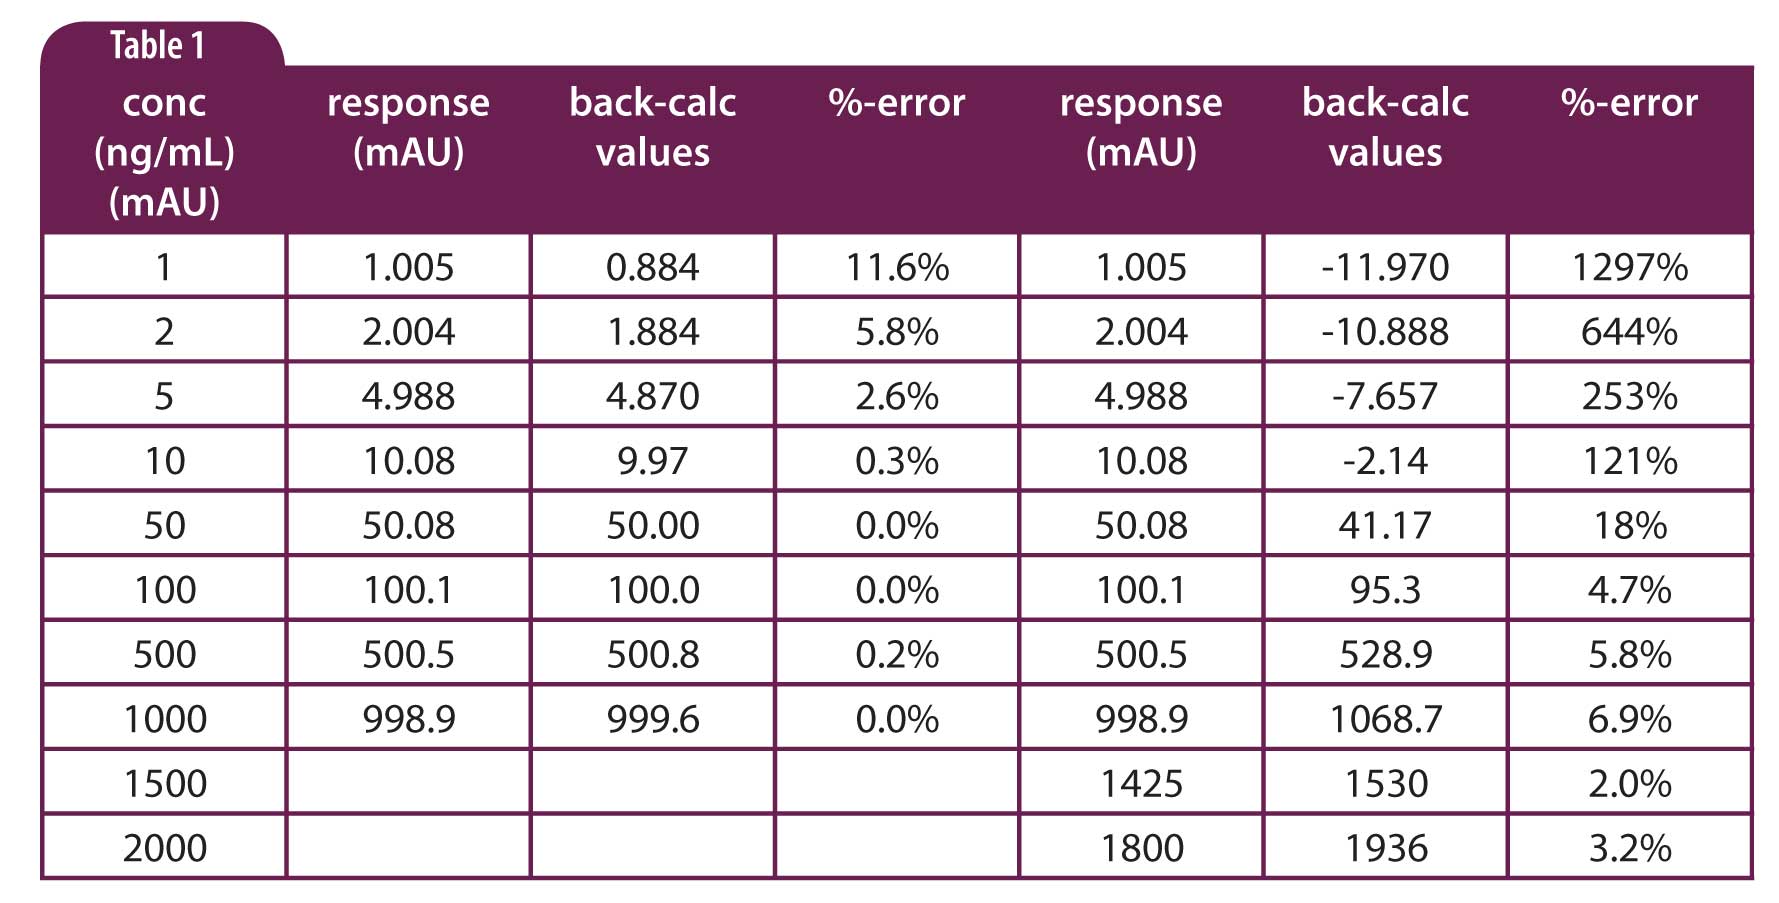
Although UV detector manufacturers often advertise that their detectors are linear to >2 AU (>2000 mAU), I’m a bit skeptical and don’t recommend operating a UV detectors for quantitative analysis with peaks larger than 1 AU. I think an example will illustrate the reason. In Table 1, I’ve created a couple sets of data. A set of calibration standards is prepared at 1, 2, 5, 10, 50, 100 … ng/mL (or pick your favourite units) that will generate peaks of ≈1, 2, 5, 10, 50, 100… mAU – the responses in Table 1 have been filtered through a random number generator to create random errors of up to 1%. A linear regression of the 1-1000 ng/mL data range gives y = 0.999x + 0.122, with a coefficient of determination r2= 0.999. If we use the regression equation to back-calculate the concentration based on the observed response, you can see the results in the third column and the amount of error listed in the fourth column. If we consider using a product peak with a 1000 mAU response, you can see that at ≥1% of this response (≥10 mAU), errors are less than 1%. For impurities in the 0.1-0.5% range, we see errors in the 2.5-10% range, which seems reasonable for such small peaks.
 Table 1
Now let’s add just two points to the calibration curve at 1500 and 2000 mAU and let’s assume minor degree of saturation of the detector. This means that the detector will give a progressively lower than expected signal as the concentration increases. I’ve arbitrarily set the 1500 and 2000 mAU response ≈5% and ≈10% low, respectively. Now the regression equation is y = 0.923x + 12.058, with r2 = 0.998. Look at the effect of this somewhat subtle change on the errors in the back-calculated values. Assuming now that we’re using a 2000 mAU product peak, the error at 0.5% (10 mAU) is >100% and it gets worse as the impurity peak decreases (data in right-hand column). It is unlikely that errors of such magnitude would be acceptable.
What went wrong here? You can see that the 1500 and 2000 mAU points tend to lever the calibration plot down at the top with a pivot point in the midrange, so that responses ≤50 mAU result in large errors. If we had not chosen an arbitrary set of data where the slope of the regression line should be 1.0, we probably would not notice any problems when we examined the regression equation. And who’s going to complain with r2 = 0.998? You can see why I’m skeptical about working with detector response >1 AU – even a relatively small amount of non-linearity can have drastic effects on the results for small peaks. No matter what detector range you choose, you should verify adequate performance throughout the range for your samples.
This blog article series is produced in collaboration with John Dolan, best known as one of the world’s foremost HPLC troubleshooting authorities. He is also known for his research with Lloyd Snyder, which resulted in more than 100 technical publications and three books. If you have any questions about this article send them to TechTips@sepscience.com
