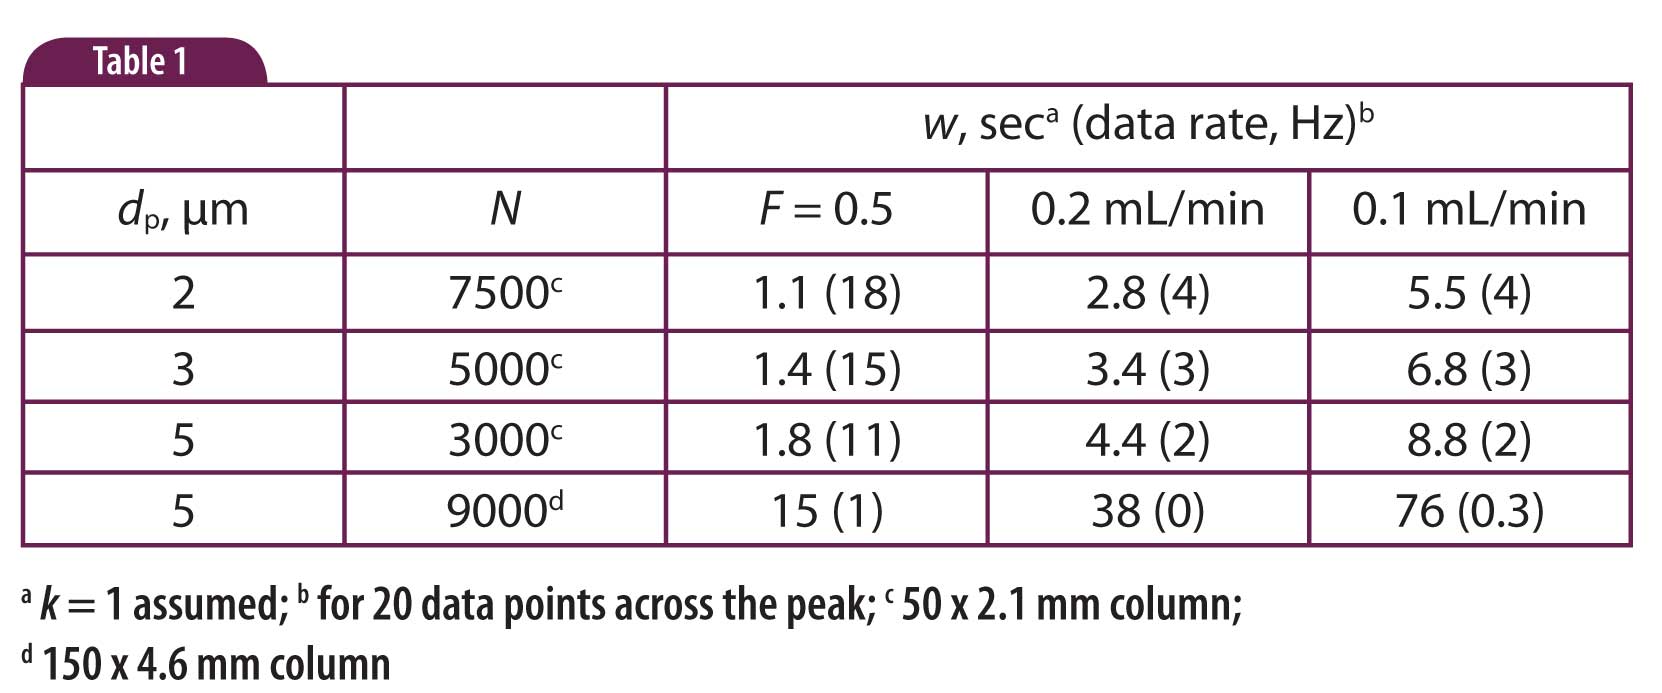
In a previous article (HPLC Solutions #91) we looked at a problem where we suspected that the data acquisition rate of the data system was too slow to gather a sufficient number of data points across a peak with a 2-µm particle column. The data of Table 1 were generated to help give us a reality check on the hypothesis. This week we’ll look at those calculations in a little more detail, in case you want to perform a similar exercise for your HPLC system.
 Table 1
For Example
Let’s choose a 2-, 3-, and 5-µm particle column in the 50 x 2.1 mm configuration as well as a conventional 150 x 4.6 mm, 5-µm column as a reference case, as summarized in Table 1. Our target is to calculate the peak width so that we can figure out the data acquisition rate required to gather 20 points across the peak.
To determine the peak width, first we need to estimate the column efficiency, or plate number, N:
N ≈ 300 (L /d p) [1]
where L is the column length in mm and d p is the particle diameter in µm. Equation (1) gives an estimate of N under realistic conditions, so it will be somewhat lower than that quoted in the column-performance data sheet. You can see in Table 1 that N ranges from 3000 to 9000 for these columns.
Next, we need to estimate the peak width for each column. I’ve assumed a worst-case scenario with a short retention time, so the retention factor, k = 1. The peak width at baseline, w, is
w = 4 t R / √(N ) [2]
where t R is the retention time. To calculate retention for k = 1 at a flow rate,
F = 0.5 mL/min, we use
t R = t 0 (1 + k) [3]
where t0 is the column dead-time. This is determined as
t 0 = V M / F [4]
where V M is the column volume in mL. For the 50 x 2.1 mm column,
V M ≈ 0.1 mL (or V M ≈ 1.5 mL for the 150 x 4.6 mm column). Working back through equations 4, 3 and then 2, we get a peak width of about 1.1 sec for the short, 2-µm column. This and peak widths for the other columns (and other flow rates) are shown in Table 1. (Note that the values in Table 1 have been rounded for display purposes; if you are repeating these, carry several decimal places through the process.)
Additional entries on the right of Table 1 are for lower flow rates than the reference 0.5 mL/min. When flow is changed and all other things kept constant, t0 should change, as should the retention times (assuming constant k-values). Lower flow rates, as expected, will increase peak widths and the method run time, but should have little effect on the separation itself, because N for most small-particle columns is not affected much by flow-rate changes.
The Bottom Line
You can see from the data of Table 1 and from last week’s discussion that the advantages of small particle columns – faster runs, sharper peaks, and potentially higher plate numbers – do not come without some costs. One of those costs is that narrower peaks require higher data-acquisition rates to adequately define the peaks.
This blog article series is produced in collaboration with John Dolan, best known as one of the world’s foremost HPLC troubleshooting authorities. He is also known for his research with Lloyd Snyder, which resulted in more than 100 technical publications and three books. If you have any questions about this article send them to TechTips@sepscience.com
