These articles will provide clear and simple explanations of the various equipment and processes involved with GC analysis so that everyday users are more comfortable and more effective at getting their jobs done and providing high-quality analytical results.
Did you ever wonder why a given method that works with one sample solvent doesn’t work when the solvent is changed? Have you been thinking of changing carrier gas type from helium to hydrogen to save costs but are not sure if it is worth the aggravation? Do you have a standard operating procedure (SOP) for your gas chromatographs that dictates what routine maintenance should be done and when, or do you wait until things stop working before you pay attention? Have you ever replaced your split vent trap? Do you even know what a split vent trap is?
Successful GC analysis requires that all parts involved with the analysis are working. The quality of an analysis is only as good as its weakest part. In GC, there is considerable opportunity to “get it wrong” or only “partially right”. Unfortunately, even if you have read all the manuals (does anyone do that?) and have attempted to understand the fundamentals by reading various publications, much of the information is out of date, specific to a given set of experiment conditions, or even wrong. To complicate the matter further, some “best practices” and recommendations are specific to the particular instrument, configuration, sample and setpoints chosen and are inappropriate otherwise.

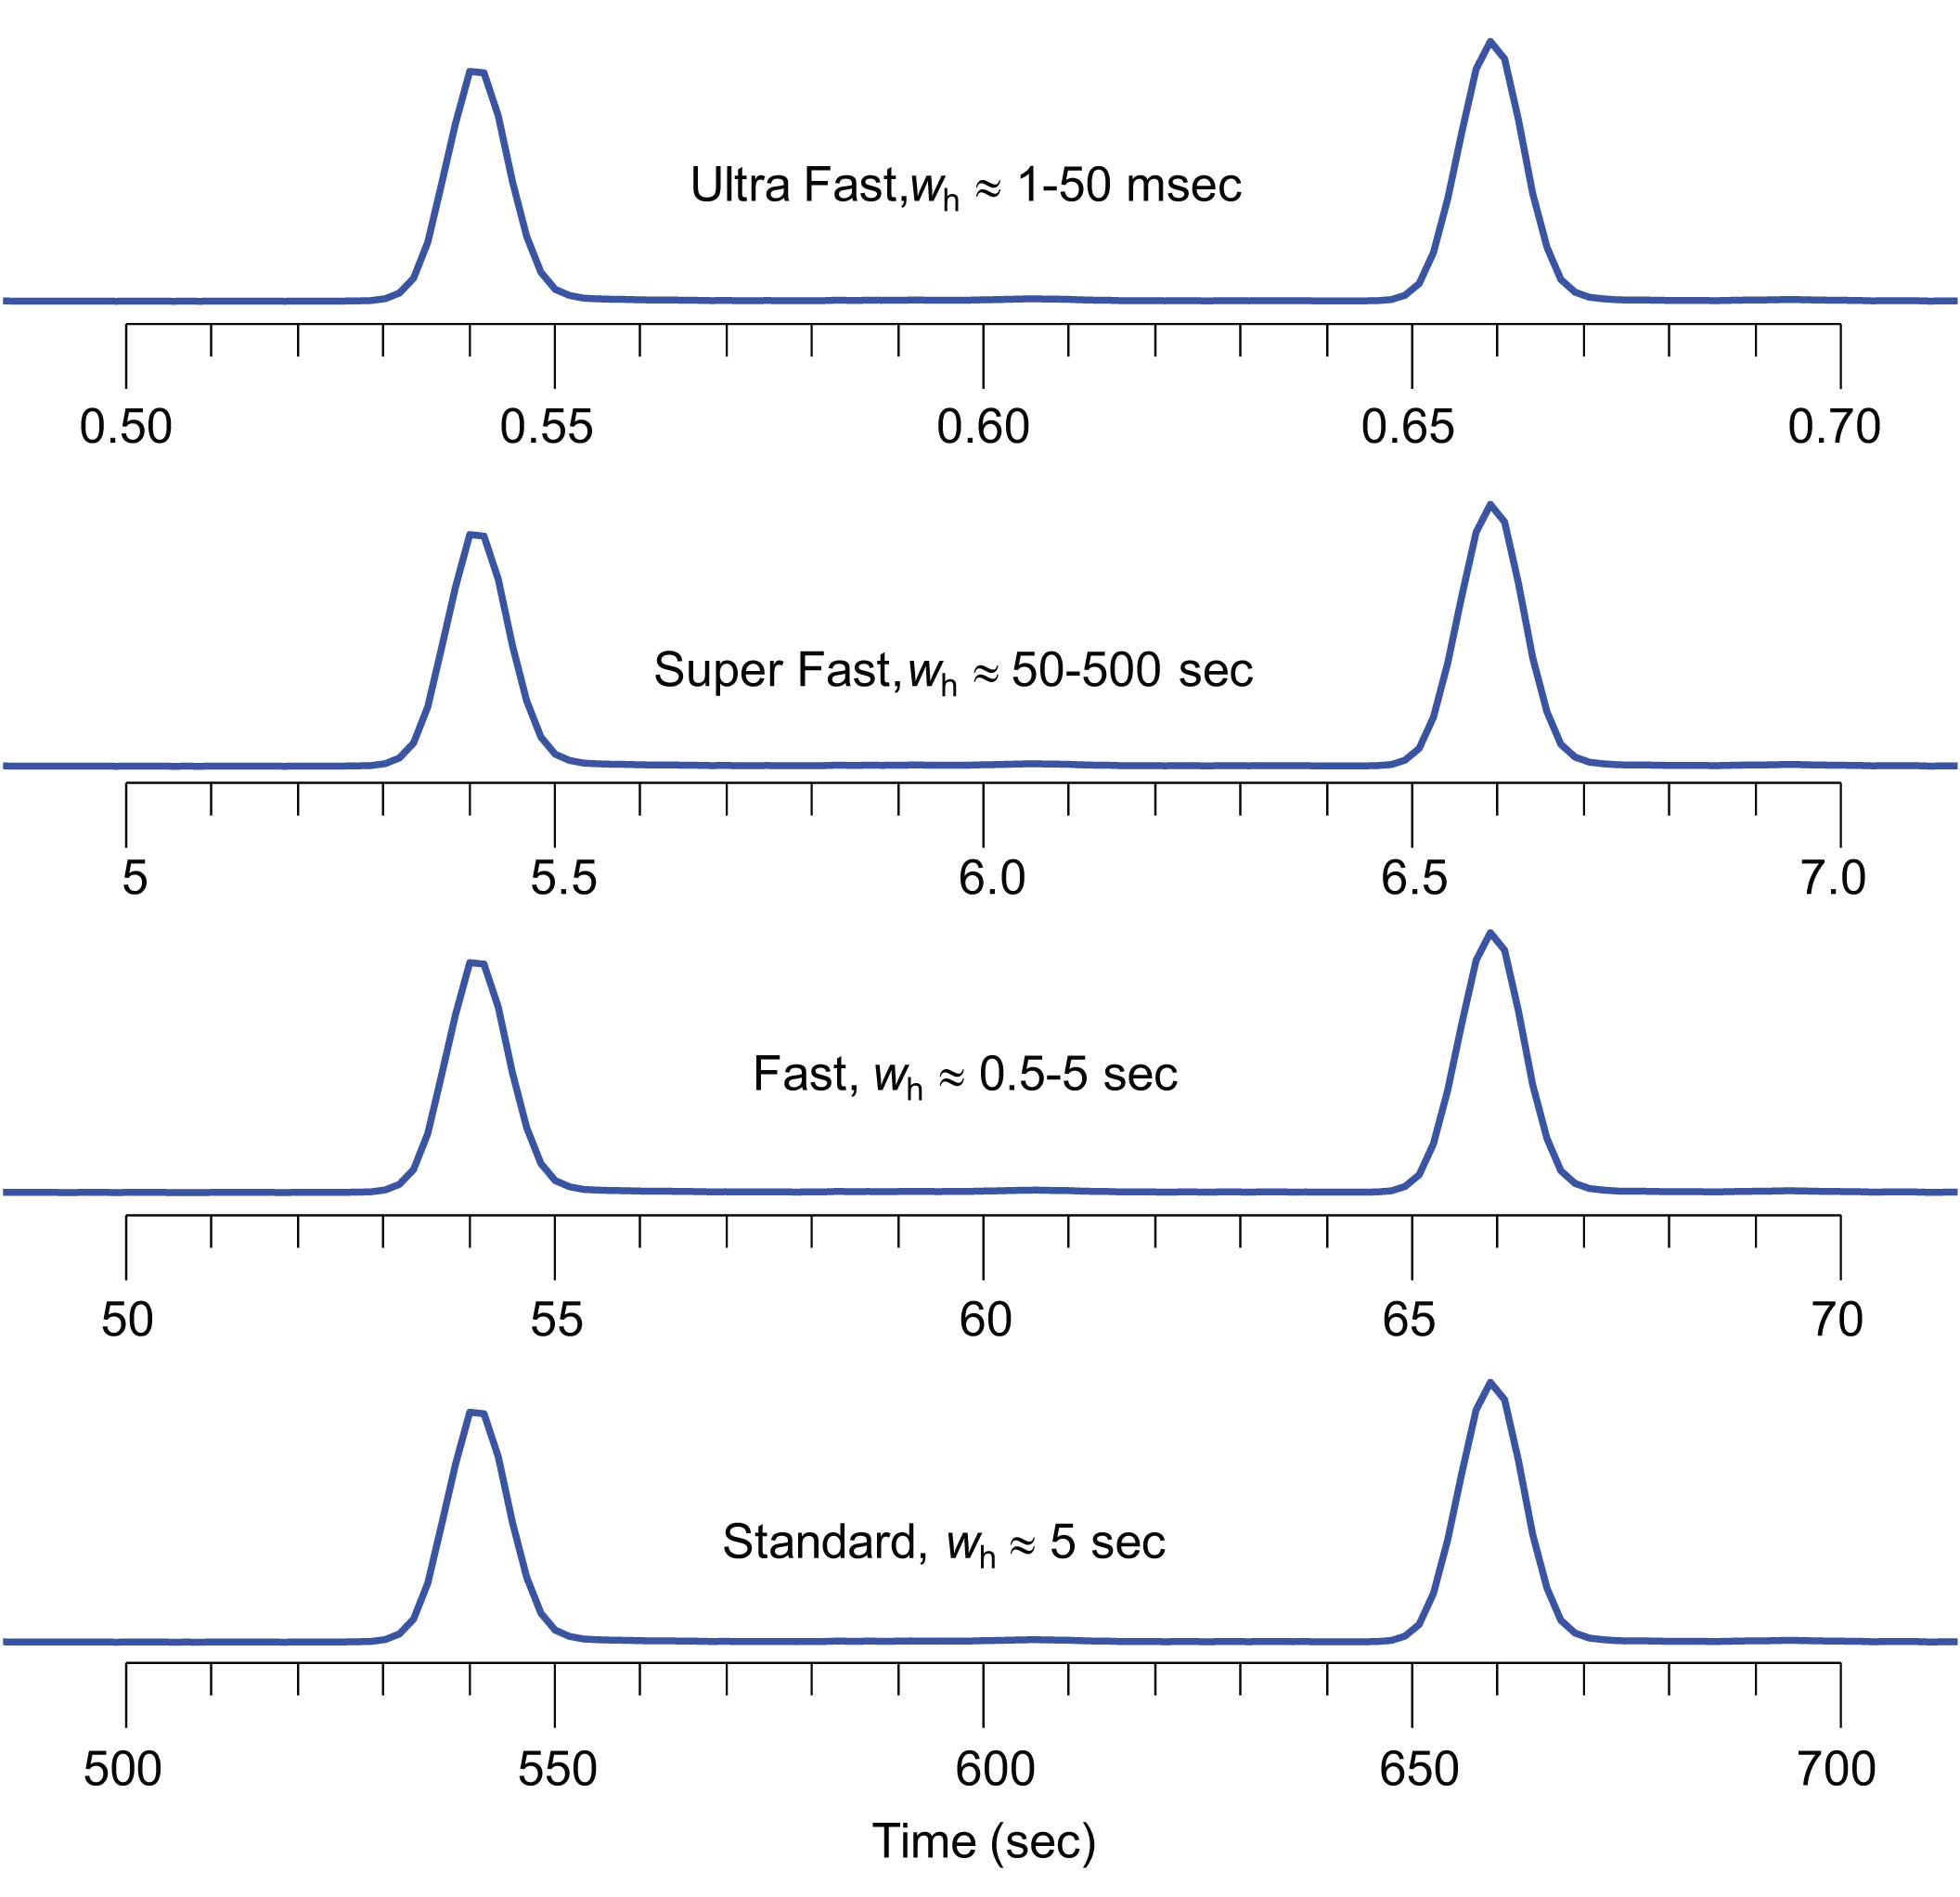
Figure 1: The definition of the speed of an analysis is often described by the width of the resulting peaks. Typical temperature-programmed GC with 25 m x 250 μm i.d. capillary columns generate peak widths of approximately 1-5 sec at half height (wh) [1,2].
In order to get the most out of GC analysis, one must first define the relevant context of the discussion and measures or “metrics”. Let’s take the topic of Fast GC as an example. What is Fast? Some answer this question from a theoretical slant based on the widths of peaks at half height (wh) (Figure 1). [1,2]
However, when I ask GC users this question, the most typical reply I get is “faster than what I am doing now”. I call this “faster GC” because it speaks more to the ever-present drive to do better (cheaper, faster, more with same effort …). So it is important in any discussion about Fast GC to include not only theoretical considerations relating to GC separation speed, but also the motivations (goals) for having the discussion in the first place. From there, one can more clearly discuss what is typical, any trade-offs involved, and how best to move toward meeting the goals.
To deal with the instrumental aspects, I will segment gas chromatograph systems into several categories that will be presented on a rotating basis. There are three categories that deal with the core gas chromatograph: inlets (the interface through which sample is introduced into the column); columns (where separation takes place); detectors (used to indicate when something elutes from the column and how much is there). A fourth category involves sample introduction devices such as automatic liquid samplers (ALS), headspace, purge & trap, pyrolysers, thermal desorbers, valves, etc. The fifth category involves data acquisition, analysis and reporting.
When dealing with a specific topic within a category, concepts of the processes involved will be discussed and associated metrics explained. For example, when discussing the split/splitless inlet, sample evaporation processes will be described, as will the interplay between pressures, flows and temperatures. Terms such as discrimination, recovery and overload will be clarified, and typical maintenance protocols recommended.
The ultimate goal of these articles is to help analysts get the most out of GC analysis that is reasonably feasible. “Reasonably feasible” is specific to the equipment, environment (e.g., the lab), time, resources available and expertise of the user. Terms and metrics specific to each area being discussed will be introduced as needed in the articles. But let’s finish this first article with a couple of common terms because they will be used in most discussions relating to the quality of an analysis. Much more detail on the definitions common to analytical measurements in general can be found in the International vocabulary of metrology — Basic and general concepts and associated terms (VIM) [3].

Figure 2: Accuracy and precision are common terms to describe the quality of a given analysis. Analysis can be precise but not accurate and vice versa. A high-quality method with rugged conditions will yield both precise and accurate results.
The accuracy of an analytical result (Figure 2) reflects how close it is to the true value. Accuracy is the goal of both qualitative (what is it?) and quantitative (how much is there?) analyses. However, many practices, instrument limitations, systematic and random errors conspire to reduce the accuracy one can actually attain. As is the case with most measurements, statistics are used to indicate the level of accuracy of a given result, and thereby give the level of “confidence” one might have in the result (figure 2).
The precision of analytical results reflect how tightly the repeated measurements of a given sample agree with each other. One can have very precise results but still be totally wrong (inaccurate).
Precision can be subdivided into to major subcategories: reproducibility and repeatability. These terms are often used incorrectly. The repeatability of a measurement is the precision of the results for a sample when using the same measurement procedure, process, operator, instrument, operating conditions and location, over a short period of time. In capillary GC, for example, a repeatability of 1% relative standard deviation (RSD) in peak area is considered good.
Reproducibility is the precision of results for analyses that were repeated with some change in location, operator, measuring systems and/or measurement conditions. It should be obvious that reproducibility will always be worse than repeatability because there are more opportunities for various errors and biases to impact results. A given operator might achieve a quantitative repeatability of 1% RSD on a single instrument, but only 15% RSD when pooling results from different instruments with different columns, conditions, etc.
References
[1] Blumberg, L. M.; Klee, M. S. Proc. 20th International Symposium of Capillary Chromatography; Sandra, P., Ed.; Riva del Garda, Italy, May 26-29, 1998.
[2] M.M. van Deursen, J. Beens, H.-G. Janssen, P.A. Leclercq, C.A. Cramers, Journal of Chromatography A, 878 (2000) 205 -213
[3] Joint Committee for Guides in Metrology, JCGM 200:2008, http://www.bipm.org/
This series of articles is brought to you in collaboration with Dr Matthew S. Klee, internationally recognized for contributions to the theory and practice of gas chromatography. His experience in chemical, pharmaceutical and instrument companies spans over 30 years. During this time, Dr Klee’s work has focused on elucidation and practical demonstration of the many processes involved with GC analysis, with the ultimate goal of improving the ease of use of GC systems, ruggedness of methods and overall quality of results.
