With today’s data systems for HPLC, we tend to take peak measurement for granted. Much of the time we’re pretty safe if we use the default integration conditions, but this is not always the case. In this HPLC Solutions series on integration, we’ll look at how peaks are integrated and what can go wrong. This instalment centres on the integration process itself.
Conceptually, the measurement of a peak’s height or area is pretty simple. For peak height, just measure the vertical distance from the baseline to the highest point. For area, start measuring the peak height when the peak starts to rise from the baseline and stop when it returns, then add up all the individual height measurements and call it the area.
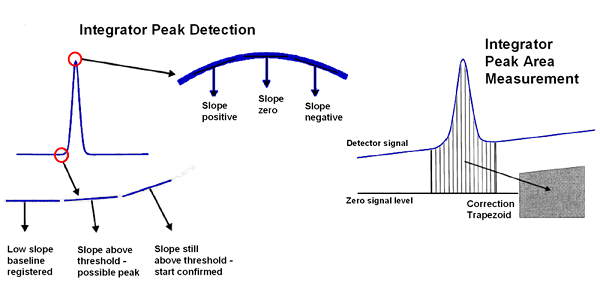
In Figure 1 we can get an idea of what takes place. First, the system must determine when the peak actually rises above the baseline. This is shown at the left edge of the left-hand peak of Figure 1. One of two techniques is common. In one, the slope of the baseline is measured over a small time segment. This slope is compared to the slope for the next segment, and the next, and so forth. When the slope is consistently rising (according to some pre-determined threshold value), the peak is determined to exist, and the vertical distance from the baseline is measured for each time segment until the peak returns to the baseline. Alternatively, the vertical distance from the baseline is measured for each segment. When a certain number of points in a row, for example, 5 or 10, show an increasing trend, the peak measurement is started.

Figure 1
The top of the peak is determined by taking the first derivative of the peak height for each successive segment. When this value goes to zero, it is an indication that the sequence of measurements, or the slope, is going from an increasing series to a decreasing one as the top of the peak is crossed. The retention time is determined at this point, and the peak height is assigned to the segment with the largest height. As a side note, the retention time, or highest point in the peak, usually is ahead of the centre of mass of the peak, because most HPLC peaks tend to tail a bit.
Pretty simple, isn’t it? Well there are some complications. One is shown at the right, where a drifting baseline is observed. Most of us operate the data system with the autozero function turned on. This automatically sets the baseline at the bottom of the display when an injection is made so that the chromatogram is easier to see. However, if the baseline signal – UV absorbance for an ultraviolet detector – is greater than a true zero signal, every point in the chromatogram will have a segment height greater than zero. To correct for this, the data system determines where the apparent baseline is and subtracts the height value for each segment that falls between zero and the baseline (the correction trapezoid in Figure 1). This gives a corrected signal where the baseline is zero and the peak height and area reflect the size of the peak above the baseline.
Further corrections have to be made if the baseline is drifting, as it is seen in the right-hand example. Determining exactly where the baseline lies and when the peak rises from and returns to the baseline is complicated by baseline noise and drift, as well as how badly the peak fronts or tails. It is quite amazing that the default integration conditions actually work for most applications! We’ve come a long way from the early days of HPLC, where one way to measure the peak was to cut the peak out of the chromatogram (recorded on a strip-chart recorder) with a pair of scissors and then weigh it on an analytical balance. Cut-and-weigh was only one of the rather crude techniques used for quantification of peaks before modern integrators were introduced.
In the next HPLC Solutions we’ll look at some of the adjustments that can be made if we don’t like the default integration conditions.
This blog article series is produced in collaboration with John Dolan, best known as one of the world’s foremost HPLC troubleshooting authorities. He is also known for his research with Lloyd Snyder, which resulted in more than 100 technical publications and three books. If you have any questions about this article send them to TechTips@sepscience.com


