In HPLC Solutions #127 we took a brief look at how HPLC integrators detect and measure a peak’s height or area. Much of the time the default settings for the data system are sufficient for reliable operation, but you may find that the integration process isn’t quite the way you want it. Perhaps the system misses small peaks or it may pick too many peaks. We’ll look here at some of the options available to adjust the integration process. Note that the names of these functions will vary depending on the brand of system you are using.
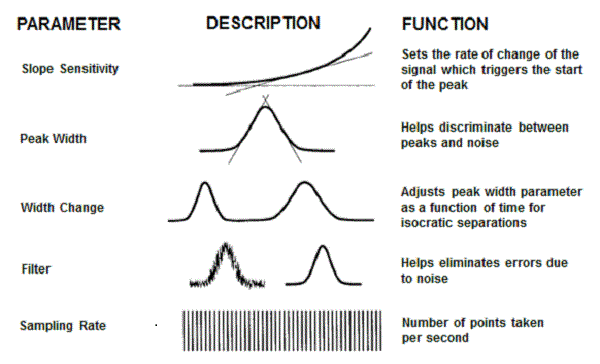
Figure 1 summarizes some of the integration settings that are commonly available for adjustment. Be sure to consult the documentation for your data system to see the details on how to use these settings. As mentioned last time, the integration algorithms do a pretty good job of determining the starting and ending points for a peak if the peak is large enough, the baseline is smooth enough, and there isn’t too much drift on the baseline. Change any of these and you may miss the start or end of the peak or miss the peak altogether. On the other hand, if the sensitivity is too high, you may end up integrating many more small peaks than you are interested in. The slope sensitivity is the adjustment that may help take care of this problem. By making the system more or less sensitive to a change in baseline slope, you can adjust whether or not peaks are found or missed. An alternative technique, if you are picking up too many peaks, is to turn on integration only for a certain time segment of the chromatogram or you can ignore peaks that are below a specific height or area.

Figure 1
Peaks in a normal isocratic run will gradually get broader throughout the run. For gradients, the peaks are all about the same width throughout the run. You can adjust the peak width settings so, for example, very broad peaks in the background are ignored.
Excessive baseline noise can make it hard to distinguish a peak from the baseline or may just make it look bad. The data system and/or detector usually has the capability of adding some kind of noise filtering or peak smoothing so that the peaks look better. The “time-constant” is one description of such a filter and can be thought of as a running-average filter that reports the average response for a defined number of data points. As a rule of thumb, the time constant should be no larger than about one-tenth of the peak width. So a peak width of 10 sec could tolerate a 1-sec time constant. This would smooth the peak, making it easier to visualize as well as to integrate.
Data systems sample the detector output at a specific frequency. It is important that enough points are gathered across a peak so that it is well defined and the reported area is reliable. With the introduction of UHPLC, peak widths are narrower than with conventional HPLC systems, so the data rate available often is faster – up to 200 Hz (points per second). This makes sure that all peaks have enough data points for good definition. However, it only takes 15-20 data points across a peak to adequately determine the peak area and retention time – more points than this tend to collect noise faster than enhance the signal. For example, a 1-sec wide peak would need a data rate of 20 Hz (20 points per second x 1 sec = 20 points across the peak) for adequate performance. A system set to 100 Hz would collect five times as much data as needed, which also unnecessarily uses data storage space. A good practice is to collect data at a high frequency during R&D activities so you don’t miss anything, but when the method is set up for routine use, reduce the data rate to 15-20 points per peak to save disk space while maintaining adequate data for good peak definition.
Because it is hard to outsmart a modern data system, I recommend that you set up your method and run representative chromatograms across the range of sample concentrations you expect, allowing the data system to adjust itself. If you don’t like the results, you can tweak the settings, but my guess is that you will be happy with the default settings most of the time.
This blog article series is produced in collaboration with John Dolan, best known as one of the world’s foremost HPLC troubleshooting authorities. He is also known for his research with Lloyd Snyder, which resulted in more than 100 technical publications and three books. If you have any questions about this article send them to TechTips@sepscience.com


